vwap inside bar jmrjm vwap inside bar which helps to take guage trend with vwap and and help to understand when market taking pause due to bulls and bears fight. Then we can take a trade in trend with winners.
Cerca negli script per "inside bar"

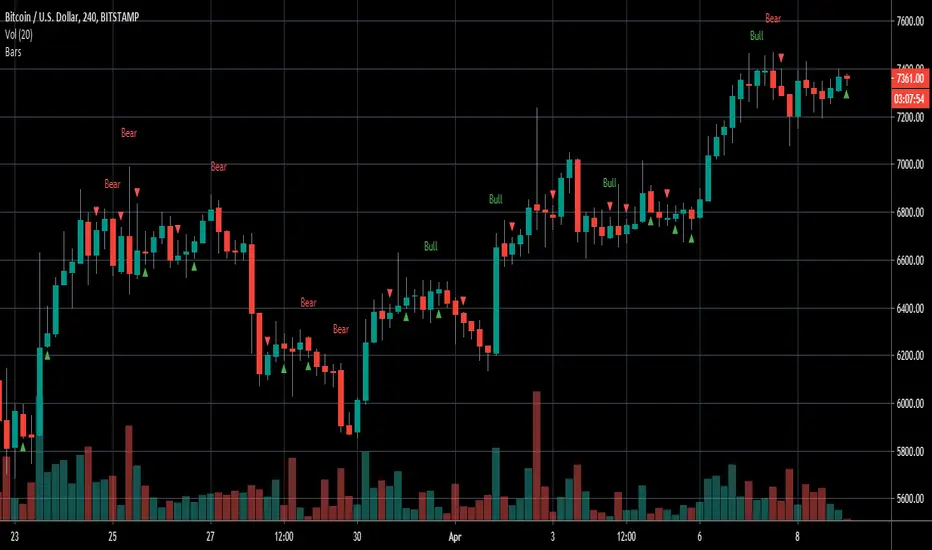
Engulfing/Inside BarsVery basic script to help discretionary traders with their candlestick pattern analysis
This script shows a colored arrow on top or below the candlestick indicating a bearish/bullish inside bar formation
also shows text with "bull" or "bear" on top of the candle when a bullish or bearish engulfing pattern surges.
big thanks to the pinescript reference manual & everyone that has open source codes bc i got stuck 50 bajillion times
Cheers.
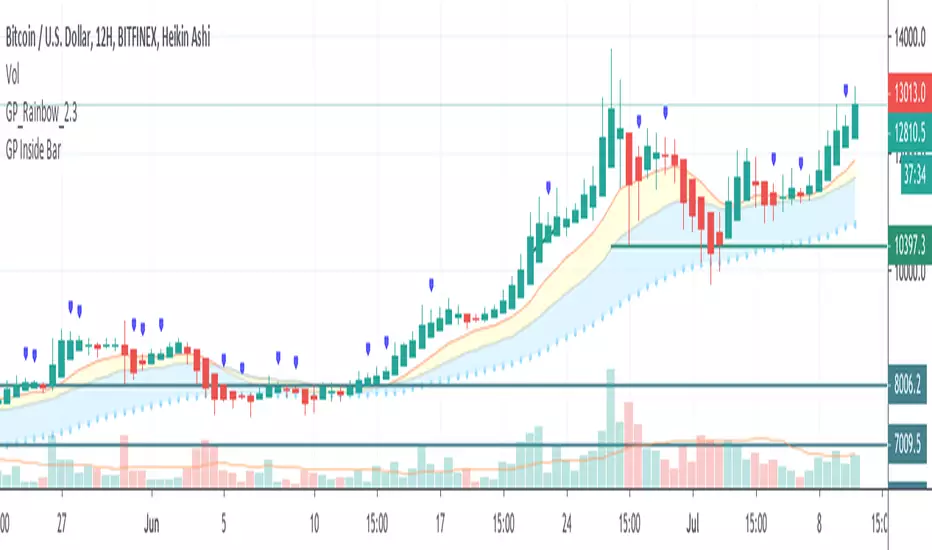
Elite By Ashu4750Inside Bar Detection:
The script identifies inside bars, which are candles where the high is lower and the low is higher than the previous bar. It tracks the high and low of the mother candle (the candle preceding the inside bars) and plots the ranges on the chart using lines and labels.
Exponential Moving Averages (EMA):
Three EMAs are calculated and plotted (with default periods of 9, 21, and 50). This is a classic trend-following technique used to smooth price data and identify the direction of the market.
Bollinger Bands (BB):
The script includes a Bollinger Band calculation using the simple moving average (SMA) with a standard deviation multiplier. The bands help visualize volatility and potential overbought or oversold conditions.
The user can configure settings like the length of the SMA and the multiplier for the upper and lower bands.
Volume Weighted Average Price (VWAP):
The VWAP is plotted on the chart and reset based on user-defined timeframes (e.g., session, week, month). VWAP is a popular indicator for institutional trading, as it shows the average price weighted by volume and can act as support or resistance.
Crossover Signals (Buy/Sell):
A combination of crossovers between VWAP, EMAs, and Bollinger Bands triggers buy and sell signals. Specifically:
Buy signal is generated when VWAP crosses over the 9 EMA, the close crosses over the Bollinger Band line, and VWAP crosses over the Bollinger Band.
Sell signal is triggered when VWAP crosses under the 9 EMA, and similar conditions exist for the other indicators.
These signals are plotted with a green "Buy" or red "Sell" marker below the bars, and alerts are set up for both buying and selling.
Additional Bollinger Band Configuration:
The script provides more flexibility in Bollinger Bands by allowing the user to select between SMA, EMA, or SMMA for the moving average.
The user can also choose the standard deviation multiplier and whether to display the bands.
Alerts:
Buy and sell conditions are linked to alert conditions, allowing the user to be notified when a signal is triggered, based on the defined crossover logic.
Technical Breakdown:
Inside Bar Logic: Tracks inside bars and plots lines representing the high and low of the mother candle. The line and label functions are used to draw these on the chart, which provides a visual representation of the range.
EMA and VWAP Crossovers:
The 9, 21, and 50-period EMAs are calculated and used in crossover logic with VWAP. Crossovers between VWAP and EMAs are a common method for identifying potential trend changes.
Bollinger Bands:
The Bollinger Band component allows for volatility analysis by calculating the upper and lower bands based on the moving average's standard deviation.
Alert System:
Alerts are set for crossover signals, allowing for real-time notifications of potential buy and sell opportunities.
Visualization:
The script plots the EMAs, VWAP, and Bollinger Bands on the price chart. It highlights inside bar patterns and displays buy/sell markers on the chart when the specified conditions are met. These visual cues make it easier to follow the market’s movements and spot trading opportunities.
Customizability:
The script is highly customizable with inputs for:
EMA periods.
VWAP settings.
Bollinger Band parameters (moving average type, length, standard deviation).
Candle color options for inside bars.
In this traders looking for multiple indicators to analyze market trends, volatility, and price action.

Inside and Outside BarsInside Bar:
An inside bar forms when the high and low range of a candlestick is within the high and low range of the previous candlestick.
In other words, the current candlestick's high is lower than the previous candlestick's high, and the current candlestick's low is higher than the previous candlestick's low.
Inside bars indicate a period of consolidation or indecision in the market. They often occur after a strong move in price and can signal a potential reversal or continuation of the trend, depending on the context.
Outside Bar:
An outside bar (or engulfing bar) forms when the high and low range of a candlestick completely engulfs the high and low range of the previous candlestick.
In bullish outside bars, the current candlestick's high is higher than the previous candlestick's high, and the low is lower than the previous candlestick's low.
In bearish outside bars, the current candlestick's high is lower than the previous candlestick's high, and the low is higher than the previous candlestick's low.
Outside bars often indicate a significant shift in market sentiment. Bullish outside bars suggest increased bullish momentum, while bearish outside bars suggest increased bearish momentum.

InsideBar2.0Inside Bar: Inside Bar is defined as, " when candle body range falls within previous day candle body".
Some of us take the whole prices range . Here i have taken only the price range of the body of tehecandle.
I have created an indicator to identify Inside bras and draw target levels on both the sides. Traders can easily convert it into a strategy and checkout the success rate.
This script is written to identify InsideBar and then plot target 1 and target 2 irrespective the direction of following candles.
Inside Bar is here defined clearly when the whole body( Not high/Low, but Open and Close Only of the candle falls within the whole body of previous candle
Few static Variables are declared for one time use to store the following values
MotherCandle Index
High and Low of MotherCandle
Target 1 equal to size of the body of mother candle
Target 2 equal twice the size of Mother Candle
Depending upon the direction of the trend and breakout of the MotherCandle boundaries, target lines and labels are drawn.
Line.delete function is used to delete all the previous lines to keep the chart clean and not draw line on all every inside-bar detected in the past.
Label.delete function is used to delete all the previous labels for Target levels to clearly show current target levels.
barcolor() function is used to change the inside bar candle changed to "Yellow" .

Inside Reversal Engulfing BarInside bar bullish = yellow
Inside Bar bearish = orange
engulfing bar bullish = green
engulfing bar bearish = red
reversal bar bullish = blue
reversal bar bearish = purple


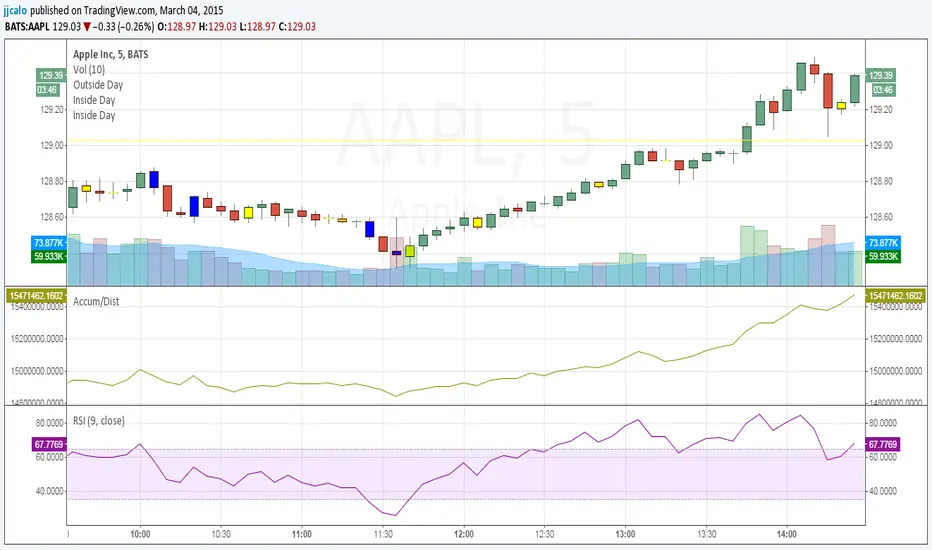
jc-Inside_BarCopyright by jack calo -- v1.0 -- 03/04/2015 -- Paint the bar yellow when it's an inside day. When the full range of a candle is equal or within the full range of the previous bar. Credit to Rob Smith and his In The Black Strategy.
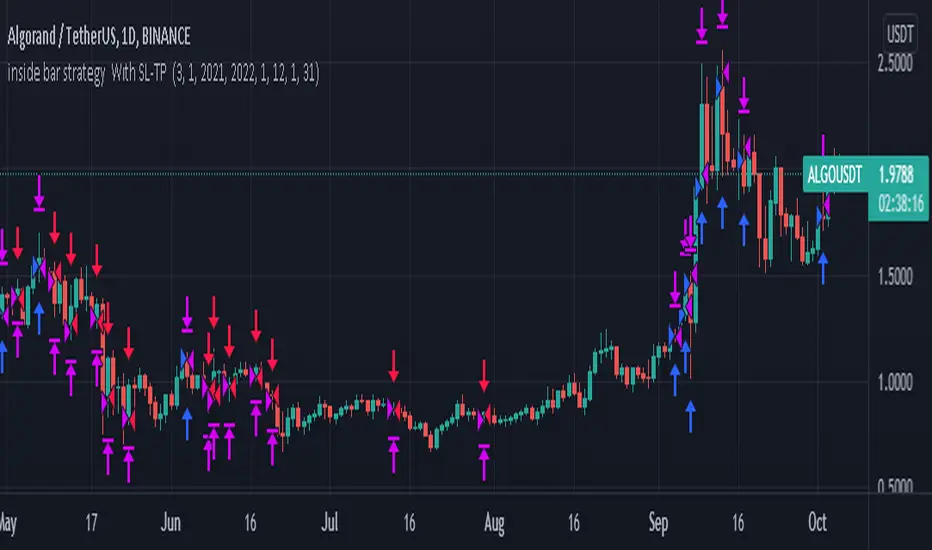
inside bar strategy Wıth SL-TP Based on strat bars to enter trades, you can use it with very low stop loss level and try all coins in daily frequency
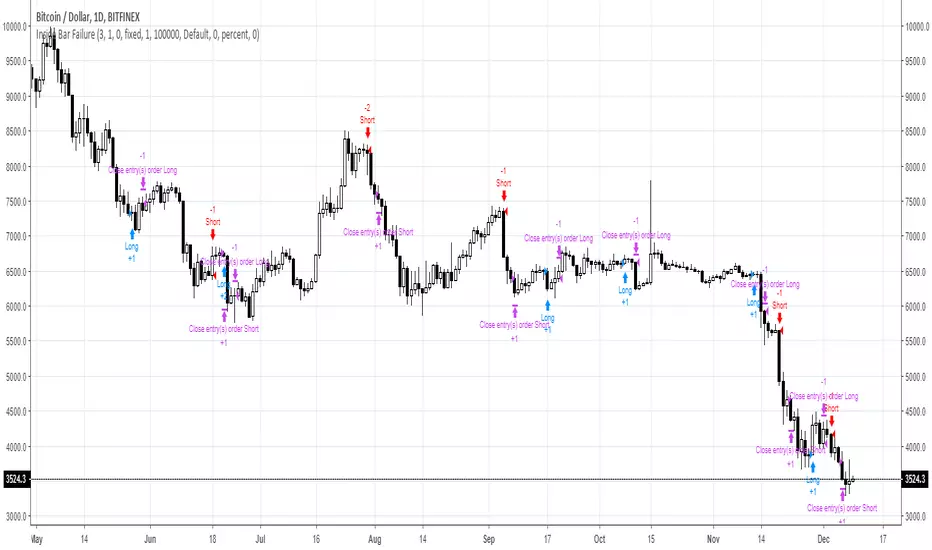
Inside Bar FailureYou can check edge profitability by adjusting the forward looking input, eg. how profitable is this signal after X bars.
Emmanuel Optuma Bar Colors v2This script colours TradingView’s Bar Chart to follow a simple, powerful bar-type logic used in Optuma-style analysis.
It makes the chart easier to read by showing the relationship between:
Up bars
Down bars
Outside bars
Inside bars
🔍 Bar Type Detection
Up Bar
Close > Previous close
→ Indicates upward strength
→ Coloured Green
Down Bar
Close < Previous close
→ Indicates downward pressure
→ Coloured Red
Outside Bar
High > Previous high and Low < Previous low
→ Market expands its range
→ Coloured Blue
Inside Bar
High < Previous high and Low > Previous low
→ Market contracts inside the previous bar
→ Follows previous bar’s colour
🎨 Colour Rules Summary
Bar Type Colour Meaning
Up Bar 🟩 Green Bullish pressure
Down Bar 🟥 Red Bearish pressure
Outside Bar 🔵 Blue Range expansion, bar resets structure
Inside Bar Same as previous bar Market indecision, continuation
🧠 Inside Bar Logic (Very Important)
Inside bars always copy the colour of the previous bar, which means:
If the previous bar was Green → inside bar becomes Green
If the previous bar was Red → inside bar becomes Red
If the previous bar was Blue → inside bar becomes Blue
This keeps the structure visually consistent and easy to read.
📈 Why This Helps Traders
This approach makes it easier to see:
✔ Trend continuation
Inside bars keep the trend colour, making swings clearer.
✔ Trend weakness
Inside bars after outside bars show contraction.
✔ Breakouts
Blue outside bars stand out as moments of range expansion.
✔ Market rhythm
The chart becomes easier to follow for beginners and advanced traders.
🧩 How to Use It
Set chart type to Bars
Add the script
Hide default colours (barcolor replaces them)
This instantly transforms TradingView into a teaching-friendly chart like Optuma.

Price Action Brooks ProPrice Action Brooks Pro (PABP) - Professional Trading Indicator
━━━━━━━━━━━━━━━━━━━━━━━━━━━━━━━━━━━━━━━━━━━━━━━━━━
📊 OVERVIEW
Price Action Brooks Pro (PABP) is a professional-grade TradingView indicator developed based on Al Brooks' Price Action trading methodology. It integrates decades of Al Brooks' trading experience and price action analysis techniques into a comprehensive technical analysis tool, helping traders accurately interpret market structure and identify trading opportunities.
• Applicable Markets: Stocks, Futures, Forex, Cryptocurrencies
• Timeframes: 1-minute to Daily (5-minute chart recommended)
• Theoretical Foundation: Al Brooks Price Action Trading Method
━━━━━━━━━━━━━━━━━━━━━━━━━━━━━━━━━━━━━━━━━━━━━━━━━━
🎯 CORE FEATURES
━━━━━━━━━━━━━━━━━━━━━━━━━━━━━━━━━━━━━━━━━━━━━━━━━━
1️⃣ INTELLIGENT GAP DETECTION SYSTEM
Automatically identifies and marks three critical types of gaps in the market.
TRADITIONAL GAP
• Detects complete price gaps between bars
• Upward gap: Current bar's low > Previous bar's high
• Downward gap: Current bar's high < Previous bar's low
• Hollow border design - doesn't obscure price action
• Color coding: Upward gaps (light green), Downward gaps (light pink)
• Adjustable border: 1-5 pixel width options
TAIL GAP
• Detects price gaps between bar wicks/shadows
• Analyzes across 3 bars for precision
• Identifies hidden market structure
BODY GAP
• Focuses only on gaps between bar bodies (open/close)
• Filters out wick noise
• Disabled by default, enable as needed
Trading Significance:
• Gaps signal strong momentum
• Gap fills provide trading opportunities
• Consecutive gaps indicate trend continuation
✓ Independent alert system for all gap types
━━━━━━━━━━━━━━━━━━━━━━━━━━━━━━━━━━━━━━━━━━━━━━━━━━
2️⃣ RTH BAR COUNT (Trading Session Counter)
Intelligent counting system designed for US stock intraday trading.
FEATURES
• RTH Only Display: Regular Trading Hours (09:30-15:00 EST)
• 5-Minute Chart Optimized: Displays every 3 bars (15-minute intervals)
• Daily Auto-Reset: Counting starts from 1 each trading day
SMART COLOR CODING
• 🔴 Red (Bars 18 & 48): Critical turning moments (1.5h & 4h)
• 🔵 Sky Blue (Multiples of 12): Hourly markers (12, 24, 36...)
• 🟢 Light Green (Bar 6): Half-hour marker (30 minutes)
• ⚫ Gray (Others): Regular 15-minute interval markers
Al Brooks Time Theory:
• Bar 18 (90 min): First 90 minutes determine daily trend
• Bar 48 (4 hours): Important afternoon turning point
• Hourly markers: Track institutional trading rhythm
━━━━━━━━━━━━━━━━━━━━━━━━━━━━━━━━━━━━━━━━━━━━━━━━━━
3️⃣ FOUR-LINE EMA SYSTEM
Professional-grade configurable moving average system.
DEFAULT CONFIGURATION
• EMA 20: Short-term trend (Al Brooks' most important MA)
• EMA 50: Medium-short term reference
• EMA 100: Medium-long term confirmation
• EMA 200: Long-term trend and bull/bear dividing line
FLEXIBLE CUSTOMIZATION
Each EMA can be independently configured:
• On/Off toggle
• Data source selection (close/high/low/open, etc.)
• Custom period length
• Offset adjustment
• Color and transparency
COLOR SCHEME
• EMA 20: Dark brown, opaque (most important)
• EMA 50/100/200: Blue-purple gradient, 70% transparent
TRADING APPLICATIONS
• Bullish Alignment: Price > 20 > 50 > 100 > 200
• Bearish Alignment: 200 > 100 > 50 > 20 > Price
• EMA Confluence: All within <1% = major move precursor
Al Brooks Quote:
"The EMA 20 is the most important moving average. Almost all trading decisions should reference it."
━━━━━━━━━━━━━━━━━━━━━━━━━━━━━━━━━━━━━━━━━━━━━━━━━━
4️⃣ PREVIOUS VALUES (Key Prior Price Levels)
Automatically marks important price levels that often act as support/resistance.
THREE INDEPENDENT CONFIGURATIONS
Each group configurable for:
• Timeframe (1D/60min/15min, etc.)
• Price source (close/high/low/open/CurrentOpen, etc.)
• Line style and color
• Display duration (Today/TimeFrame/All)
SMART OPEN PRICE LABELS ⭐
• Auto-displays "Open" label when CurrentOpen selected
• Label color matches line color
• Customizable label size
TYPICAL SETUP
• 1st Line: Previous close (Support/Resistance)
• 2nd Line: Previous high (Breakout target)
• 3rd Line: Previous low (Support level)
Al Brooks Magnet Price Theory:
• Previous open: Price frequently tests opening price
• Previous high/low: Strongest support/resistance
• Breakout confirmation: Breaking prior levels = trend continuation
━━━━━━━━━━━━━━━━━━━━━━━━━━━━━━━━━━━━━━━━━━━━━━━━━━
5️⃣ INSIDE & OUTSIDE BAR PATTERN RECOGNITION
Automatically detects core candlestick patterns from Al Brooks' theory.
ii PATTERN (Consecutive Inside Bars)
• Current bar contained within previous bar
• Two or more consecutive
• Labels: ii, iii, iiii (auto-accumulates)
• High-probability breakout setup
• Stop loss: Outside both bars
Trading Significance:
"Inside bars are one of the most reliable breakout setups, especially three or more consecutive inside bars." - Al Brooks
OO PATTERN (Consecutive Outside Bars)
• Current bar engulfs previous bar
• Two or more consecutive
• Labels: oo, ooo (auto-accumulates)
• Indicates indecision or volatility increase
ioi PATTERN (Inside-Outside-Inside)
• Three-bar combination: Inside → Outside → Inside
• Auto-detected and labeled
• Tug-of-war pattern
• Breakout direction often very strong
SMART LABEL SYSTEM
• Auto-accumulation counting
• Dynamic label updates
• Customizable size and color
• Positioned above bars
✓ Independent alerts for all patterns
━━━━━━━━━━━━━━━━━━━━━━━━━━━━━━━━━━━━━━━━━━━━━━━━━━
💡 USE CASES
INTRADAY TRADING
✓ Bar Count (timing rhythm)
✓ Traditional Gap (strong signals)
✓ EMA 20 + 50 (quick trend)
✓ ii/ioi Patterns (breakout points)
SWING TRADING
✓ Previous Values (key levels)
✓ EMA 20 + 50 + 100 (trend analysis)
✓ Gaps (trend confirmation)
✓ iii Patterns (entry timing)
TREND FOLLOWING
✓ All four EMAs (alignment analysis)
✓ Gaps (continuation signals)
✓ Previous Values (targets)
BREAKOUT TRADING
✓ iii Pattern (high-reliability setup)
✓ Previous Values (targets)
✓ EMA 20 (trend direction)
━━━━━━━━━━━━━━━━━━━━━━━━━━━━━━━━━━━━━━━━━━━━━━━━━━
🎨 DESIGN FEATURES
PROFESSIONAL COLOR SCHEME
• Gaps: Hollow borders + light colors
• Bar Count: Smart multi-color coding
• EMAs: Gradient colors + transparency hierarchy
• Previous Values: Customizable + smart labels
CLEAR VISUAL HIERARCHY
• Important elements: Opaque (EMA 20, bar count)
• Reference elements: Semi-transparent (other EMAs, gaps)
• Hollow design: Doesn't obscure price action
USER-FRIENDLY INTERFACE
• Clear functional grouping
• Inline layout saves space
• All colors and sizes customizable
━━━━━━━━━━━━━━━━━━━━━━━━━━━━━━━━━━━━━━━━━━━━━━━━━━
📚 AL BROOKS THEORY CORE
READING PRICE ACTION
"Don't try to predict the market, read what the market is telling you."
PABP converts core concepts into visual tools:
• Trend Assessment: EMA system
• Time Rhythm: Bar Count
• Market Structure: Gap analysis
• Trade Setups: Inside/Outside Bars
• Support/Resistance: Previous Values
PROBABILITY THINKING
• ii pattern: Medium probability
• iii pattern: High probability
• iii + EMA 20 support: Very high probability
━━━━━━━━━━━━━━━━━━━━━━━━━━━━━━━━━━━━━━━━━━━━━━━━━━
⚙️ TECHNICAL SPECIFICATIONS
• Pine Script Version: v6
• Maximum Objects: 500 lines, 500 labels, 500 boxes
• Alert Functions: 8 independent alerts
• Supported Timeframes: All (5-min recommended for Bar Count)
• Compatibility: All TradingView plans, Mobile & Desktop
━━━━━━━━━━━━━━━━━━━━━━━━━━━━━━━━━━━━━━━━━━━━━━━━━━
🚀 RECOMMENDED INITIAL SETTINGS
GAPS
• Traditional Gap: ✓
• Tail Gap: ✓
• Border Width: 2
BAR COUNT
• Use Bar Count: ✓
• Label Size: Normal
EMA
• EMA 20: ✓
• EMA 50: ✓
• EMA 100: ✓
• EMA 200: ✓
PREVIOUS VALUES
• 1st: close (Previous close)
• 2nd: high (Previous high)
• 3rd: low (Previous low)
INSIDE & OUTSIDE BAR
• All patterns: ✓
• Label Size: Large
━━━━━━━━━━━━━━━━━━━━━━━━━━━━━━━━━━━━━━━━━━━━━━━━━━
🌟 WHY CHOOSE PABP?
✅ Solid Theoretical Foundation
Based on Al Brooks' decades of trading experience
✅ Complete Professional Features
Systematizes complex price action analysis
✅ Highly Customizable
Every feature adjustable to personal style
✅ Excellent Performance
Optimized code ensures smooth experience
✅ Continuous Updates
Constantly improving based on feedback
✅ Suitable for All Levels
Benefits beginners to professionals
━━━━━━━━━━━━━━━━━━━━━━━━━━━━━━━━━━━━━━━━━━━━━━━━━━
📖 RECOMMENDED LEARNING
Al Brooks Books:
• "Trading Price Action Trends"
• "Trading Price Action Trading Ranges"
• "Trading Price Action Reversals"
Learning Path:
1. Understand basic candlestick patterns
2. Learn EMA applications
3. Master market structure analysis
4. Develop trading system
5. Continuous practice and optimization
━━━━━━━━━━━━━━━━━━━━━━━━━━━━━━━━━━━━━━━━━━━━━━━━━━
⚠️ RISK DISCLOSURE
IMPORTANT NOTICE:
• For educational and informational purposes only
• Does not constitute investment advice
• Past performance doesn't guarantee future results
• Trading involves risk and may result in capital loss
• Trade according to your risk tolerance
• Test thoroughly in demo account first
RESPONSIBLE TRADING:
• Always use stop losses
• Control position sizes reasonably
• Don't overtrade
• Continuous learning and improvement
• Keep trading journal
━━━━━━━━━━━━━━━━━━━━━━━━━━━━━━━━━━━━━━━━━━━━━━━━━━
📜 COPYRIGHT
Price Action Brooks Pro (PABP)
Author: © JimmC98
License: Mozilla Public License 2.0
Pine Script Version: v6
Acknowledgments:
Thanks to Dr. Al Brooks for his contributions to price action trading. This indicator is developed based on his theories.
━━━━━━━━━━━━━━━━━━━━━━━━━━━━━━━━━━━━━━━━━━━━━━━━━━
Experience professional-grade price action analysis now!
"The best traders read price action, not indicators. But when indicators help you read price action better, use them." - Al Brooks

IB & Hammer at SMA(20,50|200)IB & Hammer at SMA (20, 50, 200) Breakout/Breakdown Indicator
Overview:
The IB (Inside Bar) & Hammer at SMA Breakout/Breakdown Indicator is designed to identify breakout and breakdown opportunities using Inside Bars (IB) in combination with Simple Moving Averages (SMA 20, 50, 200) as key trend filters. This indicator is useful for traders looking to catch momentum moves after consolidation phases, confirming the trend direction with moving averages.
Indicator Logic:
Inside Bar (IB) Detection:
An Inside Bar is a candlestick that is completely within the range of the previous candle (i.e., lower high and higher low).
Inside Bars indicate consolidation, suggesting a potential breakout.
SMA Trend Confirmation:
The script uses three moving averages (SMA 20, 50, 200) to determine the trend direction.
Bullish trend: Price is above the 50 & 200 SMAs.
Bearish trend: Price is below the 50 & 200 SMAs.
The 20 SMA is used as a dynamic short-term momentum filter.
Breakout & Breakdown Conditions:
Breakout: When price breaks above the Inside Bar’s high, and the trend is bullish (above key SMAs).
Breakdown: When price breaks below the Inside Bar’s low, and the trend is bearish (below key SMAs).
Alerts can be set to notify traders of potential trade opportunities.
Features:
✅ Identifies Inside Bars (consolidation zones).
✅ Uses SMA (20, 50, 200) for trend confirmation.
✅ Breakout/Breakdown signals based on Inside Bar structure.
✅ Customizable Moving Averages & Alerts.
✅ Visual markers for easy trade identification.
How to Use:
Confirm Trend Direction:
If the price is above SMA 50 & 200, look for breakout trades.
If the price is below SMA 50 & 200, look for breakdown trades.
Watch for Inside Bars:
The script highlights Inside Bars with a specific color (configurable).
These bars indicate a low-volatility phase, preparing for a breakout.
Trade on Breakout/Breakdown:
Breakout: Enter long when the price breaks above the Inside Bar’s high (bullish trend).
Breakdown: Enter short when the price breaks below the Inside Bar’s low (bearish trend).

Inside/Outside Bar Direction Highlighter
Here’s a trading indicator in Pine Script (v6) that combines the essence of the Inside Bar, Outside Bar, and directional patterns inspired by TT3 Theory. This indicator highlights bars based on their classification as inside, outside, or directional and provides potential trade signals.
Inside Outside Indicator
Explanation:
Bar Classification:
Inside Bar: Current high is less than the previous high, and the low is greater than the previous low.
Outside Bar: Current high exceeds the previous high, and the low breaks below the previous low.
Up/Down Bars: Closing prices relative to the previous high/low.
Visual Highlights:
Bars are visually highlighted with colors for easy identification.
Trade Signals:
Long Signal: When the close crosses above the previous high and it's a directional up bar.
Short Signal: When the close crosses below the previous low and it's a directional down bar.
Customizable Inputs:
Colors for inside, outside, up, and down bars can be modified.
You can copy and paste this script into the Pine Editor on TradingView to see it in action. Adjust the logic to fit your trading strategy as needed.
You said:
summary of how to use this indicator without buy/sell signal
ChatGPT said:
ChatGPT
How to Use the Inside/Outside Bar Direction Highlighter Indicator (Without Buy/Sell Signals)
Understand the Bar Classifications:
Inside Bars: Highlighted in blue (default). These indicate periods of market consolidation. Look for potential breakouts in either direction.
Outside Bars: Highlighted in orange (default). These represent increased volatility, where both higher highs and lower lows are made. Watch for reversals or continuations based on broader trends.
Directional Up Bars: Highlighted in green (default). These occur when the current close is above the previous high, signaling bullish momentum.
Directional Down Bars: Highlighted in red (default). These occur when the current close is below the previous low, indicating bearish momentum.
Identify Key Patterns:
Use the highlighted bars to spot price action setups, such as:
Breakouts from inside bars.
Reversal signals following outside bars.
Continuation patterns when directional bars align with the trend.
Combine with Your Analysis:
Trend Analysis: Match bar classifications with trend direction on larger timeframes (e.g., daily, 4-hour).
Support/Resistance: Use inside and outside bars near key levels for confirmation or reversal signals.
Volume: Higher volume on directional bars strengthens the momentum signal.
Customize the Colors:
Adjust the bar highlight colors to fit your chart theme for better visibility.
No Automatic Signals:
This indicator doesn’t provide explicit buy/sell recommendations. Instead, use the visual highlights to make informed decisions based on your trading strategy.
By interpreting these bar patterns, you can better gauge market behavior and make more confident decisions without relying on preset signals.

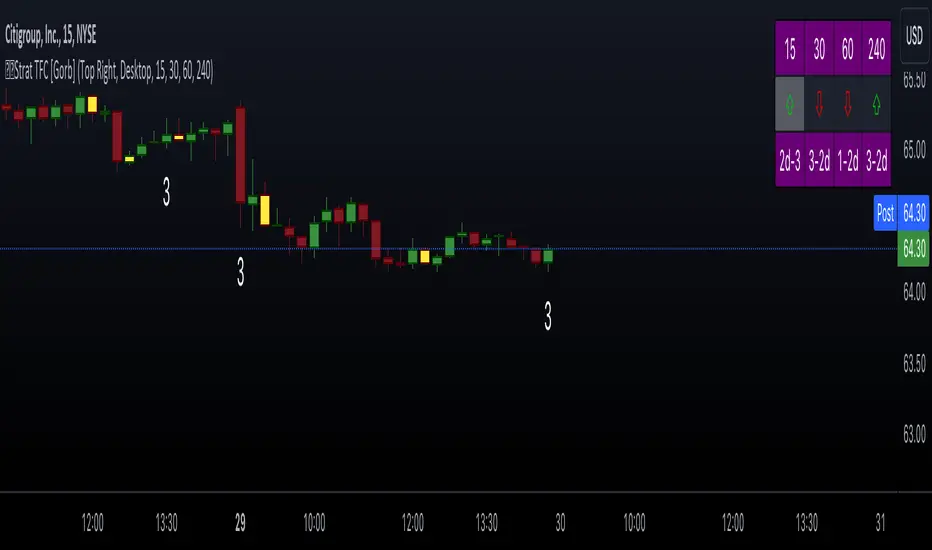
The Strat with TFC & Combo DashIntroduction:
This indicator is designed to implement "The Strat" trading strategy combined with a Timeframe Continuity Dashboard and Combo Dashboard. The Strat is a robust trading methodology that relies on price action and candlestick formations to make trading decisions. This script helps traders to identify specific bar types such as Inside Bars (1), Continuation Up Bars (2u), Continuation Down Bars (2d), and Outside Bars (3) across multiple timeframes. It visually highlights these bar types on the chart and provides a comprehensive dashboard displaying the current state of the selected timeframes.
Key Features:
Timeframe Continuity Dashboard: Displays arrows and bar types for up to four selected timeframes.
Strat Combos Dashboard: Shows the previous and current bar types to easily spot trading setups.
Customizable Colors and Labels: Options to personalize the colors and labels for Inside and Outside bars.
Adjustable Dashboard Position and Size: Allows users to set the location and size of the dashboard for better visual alignment.
Inputs:
TFC & Combo Dash Configuration:
Show TFC & Combo Dashboard: Toggle to display the dashboard.
Show Strat Combos: Toggle to display Strat combo setups.
Location: Dropdown to select the position of the dashboard on the chart.
Size: Dropdown to choose between desktop and mobile view.
Timeframe Selection:
Timeframe 1: Primary timeframe for analysis.
Timeframe 2: Secondary timeframe for analysis.
Timeframe 3: Tertiary timeframe for analysis.
Timeframe 4: Quaternary timeframe for analysis.
Candle Visuals:
Show Inside Bar Label: Option to show label instead of color for Inside bars.
Inside Bar Color: Color picker for Inside bars.
Show Outside Bar Label: Option to show label instead of color for Outside bars.
Outside Bar Color: Color picker for Outside bars.
TFC & Combo DashboardFunctions:
The script fetches values for the selected timeframes and computes the bar types and corresponding visual elements such as arrows and background colors. The dashboard displays this information in a tabular format for easy reference during trading.
The dashboard is dynamically created based on user input for position and size. It shows the selected timeframes, bar types, and combo setups, providing a quick overview of the market conditions across multiple timeframes.
Timeframes: Displays the four user chosen timeframes that the dashboard fetches data from.
Arrow and Color: Functions to set the arrow direction and color based on current bar action. Green and up arrow: price is above it's candle open.
Red and down arrow: price is below it's candles open.
Background Color: Functions to set background color based on the bar type. White for an outside bar(3), yellow for an inside bar(1), no color for a continuation bar(2).
Strat Candle Combos: Functions to determine if the bar is an Inside(1), Continuation Up(2u), Continuation Down(2d), or Outside bar(3). Shows the previous bar and the current bar for the user's chosen timeframes.
Candle Visuals:
The script plots labels and colors for Inside and Outside bars based on user preferences. It helps in quickly identifying potential trading setups on the chart.
Conclusion:
We believe in providing user-friendly tools to help speed up traders technical analysis and implement easy trading strategies. The Strat with TFC & Combo Dashboard is a tool to assist traders in identifying potential trading setups based on The Strat methodology; to suit the users needs and trading style.
RISK DISCLAIMER
All content, tools, scripts & education provided by Gorb Algo LLC are for informational & educational purposes only. Trading is risk and most lose their money, past performance does not guarantee future results.
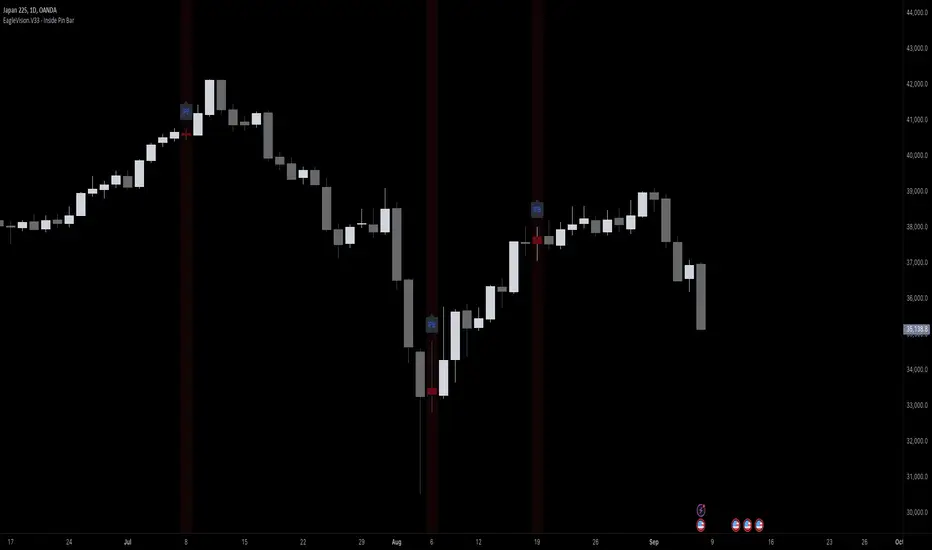
EagleVision.V33 - Inside Pin Bar EagleVision.V33 is a specialized indicator designed for traders who focus on price action. It detects and highlights the Inside Pin Bar candle pattern, a key signal that can indicate potential market reversals or trend continuations. This tool is invaluable for traders who rely on precise candlestick patterns to make data-driven decisions.
Features:
• Customizable Pattern Highlighting: EagleVision.V33 allows traders to choose custom colors to highlight Inside Pin Bar patterns directly on the chart. This makes identifying critical trading signals straightforward, even in busy market conditions.
• Pin Bar Candle Customization: Beyond just highlighting, the indicator enables users to change the color of the detected pin bar itself, ensuring that crucial patterns are immediately visible and easy to track.
• Versatile Timeframe Application: The indicator can be applied across various timeframes, from intraday (1 minute, 5 minutes) to longer-term charts (daily, weekly). Users can easily switch between timeframes within the settings, making it adaptable to different trading strategies.
• Enhanced Visual Clarity with Background Highlighting: For traders who prefer additional emphasis, EagleVision.V33 offers an option to apply a background color that highlights the entire region where the Inside Pin Bar pattern is detected.
How It Works:
• Inside Bar Identification: The indicator first identifies an Inside Bar, where a candle’s high and low fall within the range of the preceding candle (the mother bar). This is a foundational pattern in price action trading.
• Pin Bar Detection: It then checks if the candle is a Pin Bar, characterized by a small body and a prominent wick (either upper or lower), which typically signals potential market turning points.
• Pattern Highlighting & Visualization: Upon detecting both conditions (Inside Bar and Pin Bar), EagleVision.V33 highlights the pattern using customizable shapes and colors, and optionally applies a background shade to further enhance visibility.
Use Cases:
• Reversals at Key Levels: The Inside Pin Bar pattern often appears at significant support or resistance levels, signaling potential reversals. EagleVision.V33 helps traders spot these opportunities early.
• Trend Continuations: In trending markets, this pattern can confirm the continuation of a trend, providing traders with the confidence to hold positions or enter new ones.
Customization Options:
• Pattern Highlight Color: Choose a distinct color for the label or shape that marks the Inside Pin Bar pattern, making it stand out against other chart elements.
• Pin Bar Candle Color: Customize the color of the Pin Bar itself, ensuring that it is immediately recognizable on the chart.
• Background Highlighting: Optionally apply a background color to the chart area where the pattern is detected, further enhancing visual clarity and making it easier to spot potential trading opportunities.
Why EagleVision.V33 Stands Out:
EagleVision.V33 is not just another pattern detection tool; it’s engineered for precision and clarity, with highly customizable features that cater to the unique needs of price action traders. By combining both Inside Bar and Pin Bar detection, it offers a powerful edge, providing traders with actionable insights directly on their charts.
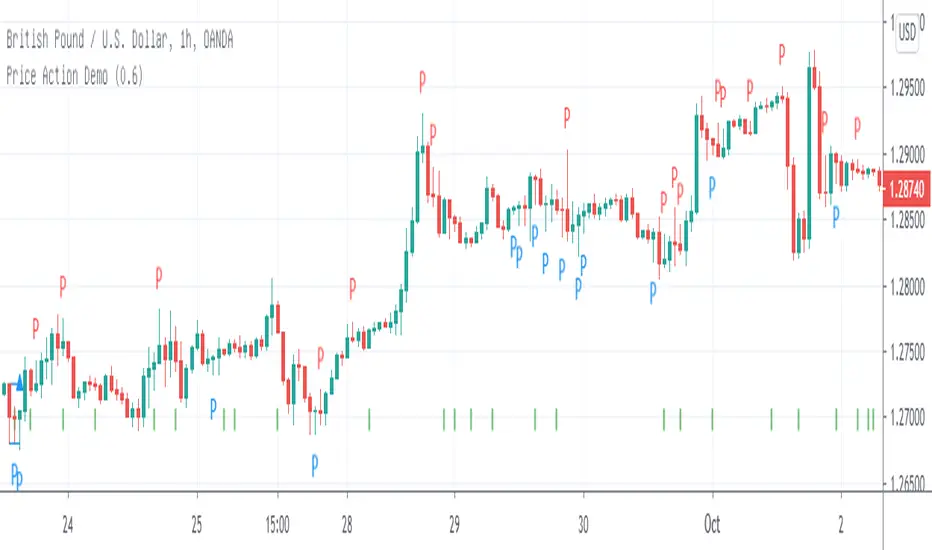
Price Action Trend and Margin EquityThe Price Action Trend and Margin Equity indicator is a multifunctional market analysis tool that combines elements of money management and price pattern analysis. The indicator helps traders identify key price action patterns and determine optimal entry, exit and stop loss levels based on the current trend.
The main components of the indicator:
Money Management:
Allows the trader to set risk management parameters such as the percentage of possible loss on the position, the use of fixed leverage and the total capital.
Calculates the required leverage level to achieve a specified percentage of loss.
Price Action:
Correctly identifies various price patterns such as Pin Bar, Engulfing Bar, PPR Bar and Inside Bar.
Displays these patterns on the chart with the ability to customize candle colors and display styles.
Allows the trader to customize take profit and stop loss points to display them on the chart.
The ability to display patterns only in the direction of the trend.
Trend: (some code taken from ChartPrime)
Uses a trend cloud to visualize the current market direction.
The trend cloud is displayed on the chart and helps traders determine whether the market is in an uptrend or a downtrend.
Alert:
Allows you to set an alert that will be triggered when the pattern is formed.
Example of use:
Let's say a trader uses the indicator to trade the crypto market. He sets the money management parameters, setting the maximum loss per position to 5% and using a fixed leverage of 1:100. The indicator automatically calculates the required position size to meet these parameters ($: on the label). Or displays the leverage (X: on the label) to achieve the required risk.
The trader receives an alert when a Pin Bar is formed. The indicator displays the entry, exit, and stop loss levels based on this pattern. The trader opens a position for the recommended amount in the direction indicated by the indicator and sets the stop loss and take profit at the recommended levels.
General Settings:
Position Loss Percentage: Sets the maximum loss percentage you are willing to take on a single position.
Use Fixed Leverage: Enables or disables the use of fixed leverage.
Fixed Leverage: Sets the fixed leverage level.
Total Equity: Specifies the total equity you are using for trading. (Required for calculation when using fixed leverage)
Turn Patterns On/Off: You can turn on or off the display of various price patterns such as Pin Bar, Outside Bar (Engulfing), Inside Bar, and PPR Bar.
Pattern Colors: Sets the colors for displaying each pattern on the chart.
Candle Color: Allows you to set a neutral color for candles that do not match the price action.
Show Lines: Allows you to turn on or off the display of labels and lines.
Line Length: Sets the length of the stop, entry, and take profit lines.
Label color: One color for all labels (configured below) or the color of the labels in the color of the candle pattern.
Pin entry: Select the entry point for the pin bar: candle head, bar close, or 50% of the candle.
Coefficients for stop and take lines.
Use trend for price action: When enabled, will show price action signals only in the direction of the trend.
Display trend cloud: Enables or disables the display of the trend cloud.
Cloud calculation period: Sets the period for which the maximum and minimum values for the cloud are calculated. The longer the period, the smoother the cloud will be.
Cloud colors: Sets the colors for uptrends and downtrends, as well as the transparency of the cloud.
The logic of the indicator:
Pin Bar is a candle with a long upper or lower shadow and a short body.
Logic: If the length of one shadow is twice the body and the opposite shadow of the candle, it is considered a Pin Bar.
An Inside Bar is a candle that is completely engulfed by the previous candle.
Logic: If the high and low of the current candle are inside the previous candle, it is an Inside Bar.
An Outside Bar or Engulfing is a candle that completely engulfs the previous candle.
Logic: If the high and low of the current candle are outside the previous candle and close outside the previous candle, it is an Outside Bar.
A PPR Bar is a candle that closes above or below the previous candle.
Logic: If the current candle closes above the high of the previous candle or below its low, it is a PPR Bar.
Stop Loss Levels: Calculated based on the specified ratios. If set to 1.0, it shows the correct stop for the pattern by pushing away from the entry point.
Take Profit Levels: Calculated based on the specified ratios.
Create a Label: The label is created at the stop loss level and contains information about the potential leverage and loss.
The formula for calculating the $ value is:
=(Total Capital x (Maximum Loss Percentage on Position/100)) / (Difference between Entry Level and Stop Loss Level × Ratio that sets the stop loss level relative to the length of the candlestick shadow × Fixed Leverage Value) .
Labels contain the following information:
The percentage of price change from the recommended entry point to the stop loss level.
Required Leverage (X: ): The amount of leverage required to achieve the specified loss percentage. (Or a fixed value if selected).
Required Capital ($: ): The amount of capital required to open a position with the specified leverage and loss percentage (only displayed when using fixed leverage).
The trend cloud identifies the maximum and minimum price values for the specified period.
The cloud value is set depending on whether the current price is equal to the high or low values.
If the current closing price is equal to the high value, the cloud is set at the low value, and vice versa.
RU
Индикатор "Price Action Trend and Margin Equity" представляет собой многофункциональный инструмент для анализа рынка, объединяющий в себе элементы управления капиталом и анализа ценовых паттернов. Индикатор помогает трейдерам идентифицировать ключевые прайс экшн паттерны и определять оптимальные уровни входа, выхода и стоп-лосс на основе текущего тренда.
Основные компоненты индикатора:
Управление капиталом:
Позволяет трейдеру задавать параметры управления рисками, такие как процент возможного убытка по позиции, использование фиксированного плеча и общий капитал.
Рассчитывает необходимый уровень плеча для достижения заданного процента убытка.
Price Action:
Правильно идентифицирует различные ценовые паттерны, такие как Pin Bar, Поглащение Бар, PPR Bar и Внутренний Бар.
Отображает эти паттерны на графике с возможностью настройки цветов свечей и стилей отображения.
Позволяет трейдеру настраивать точки тейк профита и стоп лосса для отображения их на графике.
Возможность отображения паттернов только в натправлении тренда.
Trend: (часть кода взята у ChartPrime)
Использует облако тренда для визуализации текущего направления рынка.
Облако тренда отображается на графике и помогает трейдерам определить, находится ли рынок в восходящем или нисходящем тренде.
Оповещение:
Дает возможность установить оповещение которое будет срабатывать при формировании паттерна.
Пример применения:
Предположим, трейдер использует индикатор для торговли на крипто рынке. Он настраивает параметры управления капиталом, устанавливая максимальный убыток по позиции в 5% и используя фиксированное плечо 1:100. Индикатор автоматически рассчитывает необходимый объем позиции для соблюдения этих параметров ($: на лейбле). Или отображает плечо (Х: на лейбле) для достижения необходимого риска.
Трейдер получает оповещение о формировании Pin Bar. Индикатор отображает уровни входа, выхода и стоп-лосс, основанные на этом паттерне. Трейдер открывает позицию на рекомендуемую сумму в направлении, указанном индикатором, и устанавливает стоп-лосс и тейк-профит на рекомендованных уровнях.
Общие настройки:
Процент убытка по позиции: Устанавливает максимальный процент убытка, который вы готовы понести по одной позиции.
Использовать фиксированное плечо: Включает или отключает использование фиксированного плеча.
Уровень фиксированного плеча: Задает уровень фиксированного плеча.
Общий капитал: Указывает общий капитал, который вы используете для торговли. (Необходим для расчета при использовании фиксированного плеча)
Включение/отключение паттернов: Вы можете включить или отключить отображение различных ценовых паттернов, таких как Pin Bar, Outside Bar (Поглощение), Inside Bar и PPR Bar.
Цвета паттернов: Задает цвета для отображения каждого паттерна на графике.
Цвет свечей: Позволяет задать нейтральный цвет для свечей неподходящих под прйс экшн.
Показывать линии: Позволяет включить или отключить отображение лейблов и линий.
Длинна линий: Настройка длинны линий стопа, линии входа и тейк профита.
Цвет лейбла: Один цвет для всех лейблов (настраивается ниже) или цвет лейблов в цвет паттерна свечи.
Вход в пин: Выбор точки входа для пин бара: голова свечи, точка закрытия бара или 50% свечи.
Коэффиценты для стоп и тейк линий.
Использовать тренд для прайс экшна: При включении будет показывать прайс экшн сигналы только в направлении тренда.
Отображение облака тренда: Включает или отключает отображение облака тренда.
Период расчета облака: Устанавливает период, за который рассчитываются максимальные и минимальные значения для облака. Чем больше период, тем более сглаженным будет облако.
Цвета облака: Задает цвета для восходящего и нисходящего трендов, а также прозрачность облака.
Логика работы индикатора:
Pin Bar — это свеча с длинной верхней или нижней тенью и коротким телом.
Логика: Если длина одной тени вдвое больше тела и противоположной тени свечи, считается, что это Pin Bar.
Inside Bar — это свеча, полностью поглощенная предыдущей свечой.
Логика: Если максимум и минимум текущей свечи находятся внутри предыдущей свечи, это Inside Bar.
Outside Bar или Поглощение — это свеча, которая полностью поглощает предыдущую свечу.
Логика: Если максимум и минимум текущей свечи выходят за пределы предыдущей свечи и закрывается за пределами предыдущей свечи, это Outside Bar.
PPR Bar — это свеча, которая закрывается выше или ниже предыдущей свечи.
Логика: Если текущая свеча закрывается выше максимума предыдущей свечи или ниже ее минимума, это PPR Bar.
Уровни стоп-лосс: Рассчитываются на основе заданных коэффициентов. При значении 1.0 показывает правильный стоп для паттерна отталкиваясь от точки входа.
Уровки тейк-профита: Рассчитываются на основе заданных коэффициентов.
Создание метки: Метка создается на уровне стоп-лосс и содержит информацию о потенциальном плече и убытке.
Формула для вычисления значения $:
=(Общий капитал x (Максимальный процент убытка по позиции/100)) / (Разница между уровнем входа и уровнем стоп-лосс × Коэффициент, задающий уровень стоп-лосс относительно длины тени свечи × Значение фиксированного плеча).
Метки содержат следующую информацию:
Процент изменения цены от рекомендованной точки входа до уровня стоп-лосс.
Необходимое плечо (Х: ): Уровень плеча, необходимый для достижения заданного процента убытка. (Или фиксированное значение если оно выбрано).
Необходимый капитал ($: ): Сумма капитала, необходимая для открытия позиции с заданным плечом и процентом убытка (отображается только при использовании фиксированного плеча).
Облако тренда определяет максимальные и минимальные значения цены за указанный период.
Значение облака устанавливается в зависимости от того, совпадает ли текущая цена с максимальными или минимальными значениями.
Если текущая цена закрытия равна максимальному значению, облако устанавливается на уровне минимального значения, и наоборот.

CandleStick [TradingFinder] - All Reversal & Trend Patterns🔵 Introduction
"Candlesticks" patterns are used to predict price movements. We have included 5 of the best candlestick patterns that are common and very useful in "technical analysis" in this script to identify them automatically. The most important advantage of this indicator for users is saving time and high precision in identifying patterns.
These patterns are "Pin Bar," "Dark Cloud," "Piercing Line," "3 Inside Bar," and "Engulfing." By using these patterns, you can predict price movements more accurately and therefore make better decisions in your trades.
🔵 How to Use
Pin Bar : This pattern consists of a Candle where "Open Price," "Close Price," "High Price," and "Low Price" form the "Candle Body," and it also has "Long Shadow" and "Short Shadow." In the visual appearance of the Pin Bar pattern, we have a candle body and a pin bar shadow, where the candle body is smaller relative to the shadow.
Just as the candle body plays an important role in analysis, the pin bar shadow can also be influential. The larger the pin bar shadow, the stronger the expectation of a trend reversal.
When a "bearish pin bar" occurs at resistance or the chart ceiling, it can be predicted that the price trend will be downward. Similarly, at support points and the chart floor, a "bullish pin bar" can indicate an upward price movement.
Additionally, patterns like "Hammer," "Shooting Star," "Hanging Man," and "Inverted Hammer" are types of pin bars. Pin bars are formed in two ways: bullish pin bars have a long lower shadow, and bearish pin bars have a long upper shadow. Important: Displaying "Bullish Pin Bar" is labeled "BuPB," and "Bearish Pin Bar" is labeled "BePB."
Dark Cloud : The Dark Cloud pattern is one type of two-candle patterns that occurs at the end of an uptrend. The 2-candle pattern indicates the shape of this pattern, which actually consists of 2 candles, one bullish and one bearish. This pattern indicates a trend reversal and is quite powerful.
The Dark Cloud pattern is seen when, after a bullish candle at the end of an uptrend, a bearish candle opens at a higher level (weakly, equal, or higher) than the closing point of the bullish candle and finally closes at a point approximately in the middle of the previous candle. In this indicator, the Dark Cloud pattern is identified as "Wick" and "Strong" .
The difference between these two lies in the strictness of their conditions. Important: Strong Dark Cloud is labeled "SDC," and Weak Dark Cloud is labeled "WDC."
Piercing Line : The Piercing candlestick pattern consists of 2 candles, the first being bearish and consistent with the previous trend, and the second being bullish. The conditions of the pattern are such that the first candle is bearish and a price gap is created between the two candles upon the opening of the next candle because its opening price is below (weakly equal to or less than) the closing price of the previous candle.
Additionally, its closing price must be at least 50% above the red candle.
This means that the second candle must penetrate at least 50% into the first candle. Important: Strong Piercing Line is labeled "SPL," and Weak Piercing Line is labeled "WPL."
3 Inside Bar (3 Bar Reversal) : The 3 Inside Bar pattern is a reversal pattern. This pattern consists of 3 consecutive candles and can be either bullish or bearish. In the bullish pattern (Inside Up) formed at the end of a downtrend, the last candle must be bullish, and the third candle from the end must be bearish.
Additionally, the close price must be more than 50% of the third candle from the end. In the bearish pattern (Inside Down) formed at the end of an uptrend, the last candle must be bearish, and the third candle from the end must be bullish. Additionally, the close price must be less than 50% of the third candle from the end. Important: Bullish 3 Inside Bar is labeled "Bu3IB," and Bearish 3 Inside Bar is labeled "Be3IB."
Engulfing : The Engulfing candlestick pattern is a reversal pattern and consists of at least two candles, where one of them completely engulfs the body of the previous or following candle due to high volatility.
For this reason, the term "engulfing" is used for this pattern. This pattern occurs when the price body of a candle encompasses one or more candles before it. Engulfing candles can be bullish or bearish. Bullish Engulfing forms as a reversal candle at the end of a downtrend.
Bullish Engulfing indicates strong buying power and signals the beginning of an uptrend. This pattern is a bullish candle with a long upward body that completely covers the downward body before it. Bearish Engulfing, as a reversal pattern, is a long bearish candle that engulfs the upward candle before it.
Bearish Engulfing forms at the end of an uptrend and indicates the pressure of new sellers and their strong power. Additionally, forming this pattern at resistance levels and the absence of a lower shadow increases its credibility. Important: Bullish Engulfing is labeled "BuE," and Bearish Engulfing is labeled "BeE."
🔵 Settings
This section, you can use the buttons "Show Pin Bar," "Show Dark Cloud," "Show Piercing Line," "Show 3 Inside Bar," and "Show Engulfing" to enable or disable the display of each of these candlestick patterns.

5-Minute YEN Pivot Bars 1.0The 5-Minute YEN Pivot Bars indicator is designed to identify and highlight low-range pivot bars on 5-minute charts, specifically tailored for Yen-based pairs (e.g., GBPJPY, USDJPY). By focusing on precise pip thresholds, this tool helps traders detect potential pivot points within specific trading sessions, while avoiding inside bars and other noise often seen in low-volatility conditions. This can be particularly useful for trend traders and those looking to refine their entry points based on intraday reversals.
Key Features:
- Customized Pip Thresholds for Yen Pairs:
The indicator is pre-configured for Yen pairs, where 1 pip is typically represented by 0.01. It applies these thresholds:
- Limited Range: 4 pips or less between open and close prices.
- High/Low Directionality: At least 3 pips from the close/open to the bar's high or low.
- Open/Close Proximity: 4 pips or less between open and close.
- Inside Bar Tolerance: A tolerance of 3 pips for inside bars, helping reduce false signals from bars contained within the previous bar's range.
- Session-Specific Alerts:
- The indicator allows you to enable alerts for the European Session (6:00-12:00), American Session (12:00-17:00), and London Close (17:00-20:00). You can adjust these times based on your own trading hours or timezone preferences via a time-shift setting.
- Receive real-time alerts when a valid bullish or bearish pivot bar is identified within the chosen sessions, allowing you to respond to potential trade opportunities immediately.
- Time Shift Customization:
- Adjust the "Time Shift" parameter to account for different time zones, ensuring accurate session alignment regardless of your local time.
How It Works:
1. Pivot Bar Identification:
The indicator scans for bars where the difference between the open and close is within the "Limited Range" threshold, and both open and close prices are close to either the high or the low of the bar.
2. Directional Filtering:
It requires the bar to show strong directional bias by enforcing an additional distance between the open/close levels and the opposite end of the bar (high/low). Only bars with this directional structure are considered for highlighting.
3. Exclusion of Inside Bars:
Bars that are completely contained within the range of the previous bar are excluded (inside bars), as are consecutive inside bars. This filtering is essential to avoid marking bars that typically indicate consolidation rather than potential pivot points.
4. Session Alerts:
When a valid pivot bar appears within the selected sessions, an alert is triggered, notifying the trader of a potential trading signal. Bullish and bearish signals are differentiated based on whether the close is near the high or low.
How to Use:
- Trend Reversals: Use this indicator to spot potential trend reversals or pullbacks on a 5-minute chart, especially within key trading sessions.
- Entry and Exit Points: Highlighted bars can serve as potential entry points for traders looking to capitalize on short-term directional changes or continuation patterns.
- Combine with Other Indicators: Consider pairing this tool with momentum indicators or trendlines to confirm the signals, providing a comprehensive analysis framework.
Default Parameters:
- Limited Range: 4 Pips
- High/Low Directionality: 3 Pips
- Open/Close Proximity: 4 Pips
- Inside Bar Tolerance: 3 Pips
- Session Alerts: Enabled for European, American, and London Close sessions
- Time Shift: Default 6 (adjustable to align with different time zones)
This indicator is specifically optimized for Yen pairs on 5-minute charts due to its pip calculation.

Simple STRAT Tool by nnamWhat this Indicator Does
This indicator is a very simple tool created specifically for experienced Straters. It was created for those Straters who fully understand the 1-2-3 Strat Scenarios, are in need of an easy to use tool, and do not want or need a lot of messy markings on their chart.
The indicator simply allows the user to color code the Strat 1, 2 ,3 (Inside /Outside /Up / Down) Bars as desired and by default extends lines to the right of the chart from the Highs and Lows of the previous 2 Bars giving the user a simple reference for Strat scenario structure breaks.
As shown above, the bars are color coded, but the original bar color is maintained via the border and wick.
If a bar is an Outside Bar or an Inside Bar, it is still easy to identify whether or not the bar was a Bullish or Bearish 1 or 3.
The same goes for 2UP and 2Down Bars - It is easy to identify Bullish or Bearish UP or DOWN Bars.
Optionally, as show in the screenshot below, the user can extend the lines in both directions to get an "at a glance" better understanding of where price is currently vs previous support and resistance areas.
For Straters that prefer to trade only INSIDE BAR BREAKOUTS there is an optional input setting labeled "Trade Inside Bars ONLY".
This setting turns OFF the lines that extend from the 2nd previous bar back and only displays and extend lines from the previous bar IF and ONLY IF the current bar is an INSIDE (one) bar. .
The User Input settings allow for the following customizations:
1. Custom Outside Bar Color
2. Custom Inside Bar Color
3. Custom 2 Up Bar Color
4. Custom 2 Down Bar Color
5. Turn ON or OFF color coded bars
6. Trade only INSIDE Bar Breakouts
7. Extend Lines Both Directions
8. Hide all Lines
The customizable settings above allow the user to hide all lines and turn OFF color coding without having to fully remove the indicator from the chart. This is convenient when the user has another indicator that uses color coded bars or the lines conflict with another indicator and they need to be temporarily disabled.
If you have any questions regarding this indicator please let me know. If you have any suggestions for minor tweaks to the indicator do not hesitate to ask for them.
I hope you enjoy this indicator and get some usefulness from it... HAPPY TRADING!!
NY 4H Wyckoff State Machine [CHE] NY 4H Wyckoff State Machine — Full (Re-Entry, Breakout, Wick, Re-Accum/Distrib, Dynamic Table) — One-Candle Wyckoff Re-Entry (OCWR)
Summary
OCWR operationalizes a one-candle session workflow: mark the first four-hour New York candle, fix its high and low as the session range when the window closes, and drive entries through a Wyckoff-style state machine on intraday bars. The script adds an ATR-scaled buffer around the range and requires multi-bar acceptance before treating breaks or re-entries as valid. Optional wick-cluster evidence, a proximity retest, and simple volume or RSI gates increase selectivity. Background tints expose regimes, shapes mark events, a dynamic table explains the current state, and hidden plots supply alert payloads. The design reduces random flips and makes state transitions auditable without higher-timeframe calls.
Origin and name
Method name: One-Candle Wyckoff Re-Entry (OCWR)
Transcript origin: The source idea is a “stupid simple one-candle scalping” routine: mark the first New York four-hour candle (commonly between one and five in the morning New York time), drop to five minutes, observe accumulation inside, wait for a manipulation move outside, then trade the re-entry back inside. Stops go beyond the excursion extreme; targets are either a fixed reward multiple or the opposite side of the range. Preference is given to several manipulation candles. This indicator codifies that workflow with explicit states, acceptance counters, buffers, and optional quality filters. Any external performance claims are not part of the code.
Motivation: Why this design?
Session levels are widely respected, yet single-bar breaches around them are noisy. OCWR separates range discovery from trade logic. It locks the range at the end of the window, applies an ATR-scaled buffer to ignore marginal oversteps, and requires acceptance over several bars for breaks and re-entries. Wick evidence and optional retest proximity help confirm that an excursion likely cleared liquidity rather than launched a trend. This yields cleaner transitions from test to commitment.
What’s different vs. standard approaches?
Baseline: Static session lines or one-shot Wyckoff tags without process control.
Architecture: Dual long and short state machines; ATR-buffered edges; multi-bar acceptance for breaks and re-entries; optional wick dominance and cluster checks; optional retest tolerance; direct and opposite breakout paths; cooldown after fires; distribution timeout; dynamic table with highlighted row.
Practical effect: Fewer single-bar head-fakes, clearer hand-offs, and on-chart explanations of the machine’s view.
Wyckoff structure by example — OCWR on five minutes
One-candle setup:
On the four-hour chart, mark the first New York candle’s high and low, then switch to five minutes. Solid lines show the fixed range; dashed lines show ATR-buffered edges.
Long path (verbal mapping):
Phase A, Stopping Action: Price stabilizes inside the range.
Phase B, Consolidation: Sustained balance while the window is closed and after the range is fixed.
Phase C, Test (Spring): Excursion below the buffered low with preference for several outside bars and dominant lower wicks, then a return inside.
Re-entry acceptance: A required run of inside bars validates the test.
Phase D, Breakout to Markup: Long signal fires; stop beyond the excursion extreme; objective is the opposite range or a fixed reward multiple.
Phase E, Trend (Markup) and Re-Accumulation: Advance continues until target, stop, confirmation back against the box, or timeout. A pause inside trend may register as re-accumulation.
Short path mirrors the above: A UTAD-style move forms above the buffered high, then re-entry leads to Markdown and possible re-distribution.
Variant map (verbal):
Accumulation after a downtrend: with Spring and Test, or without Spring; both proceed to Markup and may pause in Re-Accumulation.
Distribution after an uptrend: with UTAD and Test, or without UTAD; both proceed to Markdown and may pause in Re-Distribution.
Note: Phases A through E occur within each variant and are not separate variants.
How it works (technical)
Session window: A configurable four-hour New York window records its high and low. At window end, the bounds are fixed for the session.
ATR buffer: A margin above and below the fixed range discourages triggers from tiny oversteps.
Inside and outside: Users choose close-based or wick-based detection. Overshoot requirements are expressed verbally as a fraction of the range with an optional absolute minimum.
Manipulation tracking: The machine counts bars spent outside and records the side extreme.
Re-entry acceptance: After a return inside, a specified number of inside bars must print before acceptance.
Direct and opposite breakouts: Direct breakouts from accumulation and opposite breakouts after manipulation are supported, subject to acceptance and optional filters.
Targets and exits: Choose the opposite boundary or a fixed reward multiple. Distribution ends on target, stop, confirmation back against the range, or timeout.
Context filters (optional): Volume above a scaled SMA, RSI thresholds, and a trend SMA for simple regime context.
Diagnostics: Background tints for regimes; arrows for re-entries; triangles for breakouts; table with row highlights; hidden plots for alert values.
Central table (Wyckoff console)
The table sits top-right and explains the machine’s stance. Columns: Structure label, plain-English description, active state pair for long and short, and human phase tags. Rows: Start and range building; accumulation branch with Spring and Test as well as direct breakout; Markup and re-accumulation; distribution branch with UTAD and Test as well as direct short breakout; Markdown and re-distribution. Only the active state cell is rewritten each last bar, for example “L_ACCUM slash S_ACCUM”. Row highlighting is context-aware: accumulation, Spring or UTAD, breakout, Markup or Markdown, and re-accumulation or re-distribution checks can highlight independently so users see simultaneous conditions. The table is created once, updated only on the last bar for efficiency, and functions as a read-only console to audit why a signal fired and where the path currently sits.
Parameter Guide
Session window and time zone: First four hours of New York by default; time zone “America/New_York”.
ATR length and buffer factor: Control buffer size; larger reduces sensitivity, smaller reacts faster.
Minimum overshoot (fraction and absolute): Demand meaningful extension beyond the buffer.
Break mode: Close-based is stricter; wick-based is more reactive.
Acceptance counts: Separate counts for break, re-entry, and opposite breakout; higher values reduce noise.
Minimum bars outside: Ensures manipulation is not a single spike.
Wick detection and clusters (optional): Dominance thresholds and cluster size within a short window.
Retest required and tolerance (optional): Gate re-entry by proximity to the buffered edge.
Volume and RSI filters (optional): Simple gates on activity and momentum.
TP mode and reward multiple: Opposite range or fixed multiple.
Cooldown and distribution timeout: Rate-limit signals and prevent endless distribution.
Visualization toggles: Background phases, labels, table, and helper lines.
Reading & Interpretation
Solid lines are the fixed session bounds; dashed lines are buffers. Backgrounds tint accumulation, manipulation, and distribution. Arrows show accepted re-entries; triangles show direct or opposite breakouts. Labels can summarize entry, stop, target, and risk. The table highlights the active row and the current state pair.
Practical Workflows & Combinations
OCWR baseline: Each morning, mark the New York four-hour candle, move to five minutes, prefer multi-bar manipulation outside, then wait for a qualified re-entry inside. Stop beyond the excursion extreme. Target the opposite range for conservative management or a fixed multiple for uniform sizing.
Trend following: Favor direct breakouts with trend alignment and no contradictory wick evidence.
Quality control: When noise rises, increase acceptance, raise the buffer factor, enable retest, and require wick clusters.
Discretionary confluences: Fair-value gaps and trend lines can be added by the user; they are not computed by this script.
Behavior, Constraints & Performance
Closed-bar confirmation is recommended when you require finality; live-bar conditions can change until close. The script does not call higher-timeframe data. It uses arrays, lines, labels, boxes, and a table; maximum bars back is five thousand; table updates are last-bar only. Known limits include compressed buffers in quiet sessions, unreliable wick evidence in thin markets, and session misalignment if the platform time zone is not New York.
Sensible Defaults & Quick Tuning
Start with ATR length fourteen, buffer factor near zero point fifteen, overshoot fraction near zero point ten, acceptance counts of two, minimum outside duration three, retest required on.
Too many flips: increase acceptance, raise buffer, enable retest, and tighten wick thresholds.
Too slow: reduce acceptance, lower buffer, switch to wick-based breaks, disable retest.
Noisy wicks: increase minimum wick ratio and cluster size, or disable wick detection.
What this indicator is—and isn’t
A session-anchored visualization and signal layer that formalizes a Wyckoff-style re-entry and breakout workflow derived from a single four-hour New York candle. It is not predictive and not a complete trading system. Use with structure analysis, risk controls, and position management.
Disclaimer
The content provided, including all code and materials, is strictly for educational and informational purposes only. It is not intended as, and should not be interpreted as, financial advice, a recommendation to buy or sell any financial instrument, or an offer of any financial product or service. All strategies, tools, and examples discussed are provided for illustrative purposes to demonstrate coding techniques and the functionality of Pine Script within a trading context.
Any results from strategies or tools provided are hypothetical, and past performance is not indicative of future results. Trading and investing involve high risk, including the potential loss of principal, and may not be suitable for all individuals. Before making any trading decisions, please consult with a qualified financial professional to understand the risks involved.
By using this script, you acknowledge and agree that any trading decisions are made solely at your discretion and risk.
Do not use this indicator on Heikin-Ashi, Renko, Kagi, Point-and-Figure, or Range charts, as these chart types can produce unrealistic results for signal markers and alerts.
Best regards and happy trading
Chervolino
